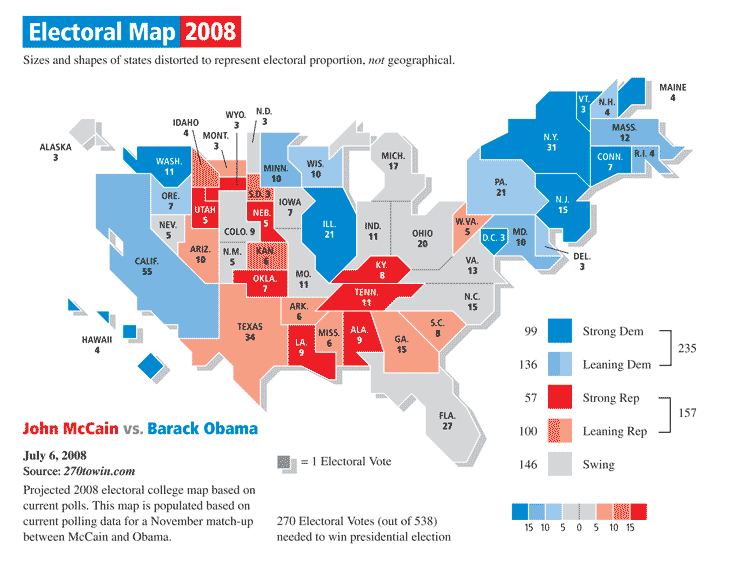
US Electoral Cartogram

Cartogram—abstract or simplified representation of statistical data on a map base or distorted map base—depicting states redrawn in exact proportion to number of electoral votes, based upon strict, mathematical grid. Created in Illustrator. Each state individually selectable.